How to Create a Forecast Chart in Excel 2016

Excel 2016 added a useful new feature: One-click forecasting to help you understand current trends and predict future ones. Here's how it works.
First you'll need a table containing a series of dates or times and values associated with those dates. For example, weekly stock prices or monthly sales data. Excel will use these values to create a new worksheet with a forecast chart.
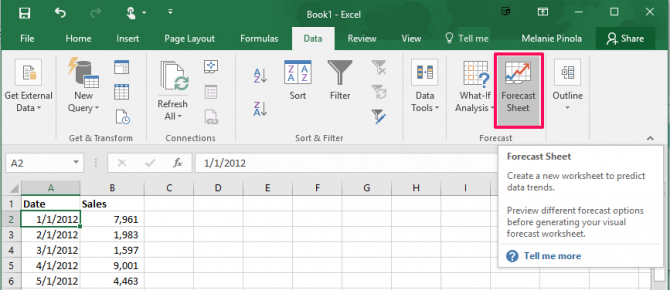
- Select any cell in one of your series. Excel will automatically select the rest of the data for you in the next step.
- Go to the Data tab and click Forecast Sheet.

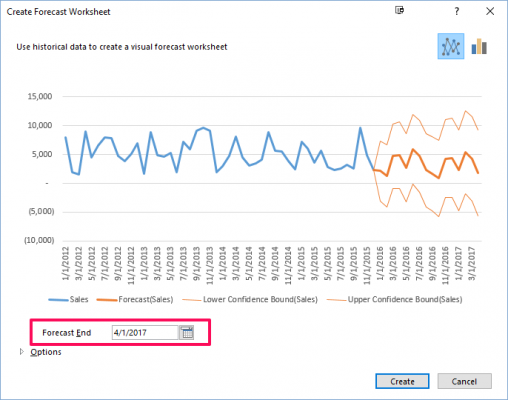
- (Optional) Adjust the forecast end date in the forecast worksheet preview.

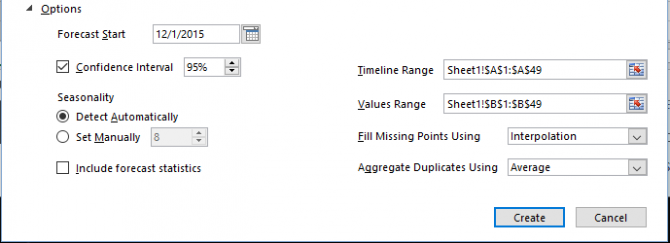
- (Optional) Click the Options menu and adjust the forecasting options.

- Click Create.
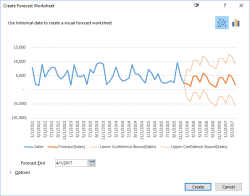
In a few moments, you'll find a new sheet in your workbook containing the forecast chart based on your historical data. In that sheet, Excel will also create a tablet containing the historical and predicted values, which you can modify if you'd like to adjust the forecast.
- How to Lock Cells in Excel 2016
- How to Remove Duplicate Data in Excel 2016
- How to Create a Waterfall Chart in Excel 2016
Stay in the know with Laptop Mag
Get our in-depth reviews, helpful tips, great deals, and the biggest news stories delivered to your inbox.
Melanie was a writer at Laptop Mag. She wrote dozens of helpful how-to guides, covering both the software and the hardware side of things. Her work included topics like SSDs, RAM, Apple, Excel, OneDrive, and detailed guides for Windows users. Outside of all her useful advice, Melanie also penned a few reviews for Laptop Mag, including Android emulators that help you run apps on your PC.
