We're Improving Our Tests: Here's How
In order to help you make the right choice when shopping, Laptop Mag is constantly looking for new tests that more accurately reflect how consumers are using mobile technology, as well as for ways to improve the tests we're already using. Today, we're announcing an improvement to our battery test, and introducing two new tests that will further enhance our reviews.
Battery Life
The Laptop Mag battery test replicates continuous web surfing over Wi-Fi until the battery is completely drained. Starting with a full battery, a notebook/tablet/smartphone runs a script that visits 50 popular web sites in a loop, pausing for 30 seconds on each, then closing and reopening the native browser with the next page. The settings are tweaked to prevent the device from entering standby mode or going into hibernation.
MORE: 10 Laptops with the Longest Battery Life
Until now, we have tested everything with the screen set to 40 percent brightness. However, given that not every screen is created equal, 40 percent brightness on one notebook could be a lot brighter than 40 percent brightness on another notebook. From now on, we will set the brightness of notebooks to 100 nits and tablets and smartphones to 150 nits, as determined by a Spyder4 colorimeter.
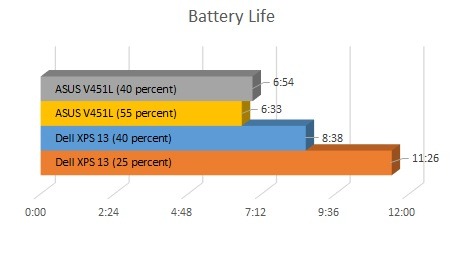
As such, we expect battery life to improve on devices with brighter screens, and endurance to decrease on those systems with dimmer displays. For example, the Dell XPS 13's display has an average brightness of 356 nits. On the older Laptop Mag Battery Test (with the screen at 40 percent brightness), it lasted 8 hours and 38 minutes. On the updated battery test, 100 nits translates to 25 percent brightness; as a result, the XPS 13 lasted 11 hours and 26 minutes, an improvement of nearly 3 hours.
Conversely, the ASUS Vivobook V451L's display has a brightness of just 173 nits. On our old battery test, the notebook lasted 6 hours and 54 minutes, but on the new version of the test (where 100 nits was 55 percent brightness), it lasted 6:33.
MORE: How We Test
Stay in the know with Laptop Mag
Get our in-depth reviews, helpful tips, great deals, and the biggest news stories delivered to your inbox.
Display Quality
We're using the Spyder4 colorimeter for more than just measuring screen brightness; we're also using it to see how good a screen is at rendering colors. Using the Dispcal app, we measure a screen's RGB color gamut and Delta-E.
RGB Color Gamut is measured on a scale of 1 to 100 percent; the closer a screen is to 100 percent, the more colors it can display in the RGB color space. Displays are capable of exceeding the RGB color space--which is not a bad thing--but at the very least, a good display will be able to render 100 percent. After testing the display, Dispcal creates a chart, shown below, that shows the color profile of the display (the colored line) as it relates to both the sRGB color space (the dotted line), and the much larger Adobe RGB color space (the solid line).
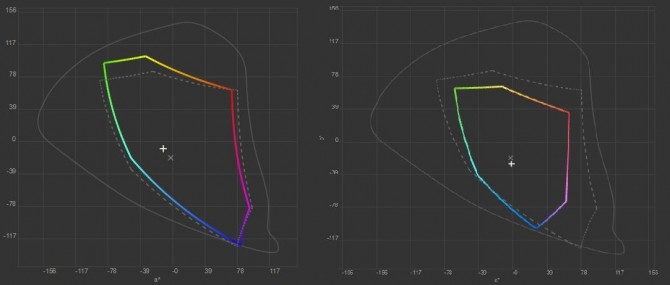
Using the Dell XPS 13 and the ASUS V451L as examples, we can see that the XPS 13 (on the left) has a gamut of 94 percent. The system is also capable of rendering a much wider spectrum of colors than the ASUS, which has a gamut of 62.3.
A screen can be capable of displaying millions of different colors, but if the green in your photos looks gray or the blue looks black, the gamut won't matter. Delta E (dE) measures how accurately the screen displays different colors with 0 being a perfect match and higher numbers reflecting lower accuracy. While one could get dE numbers for many numbers, our test measures the average. Generally, a dE of 1.0 is regarded as the smallest difference a human eye can see, but most systems we've tested register between 1.5 and 15. While some devices allow the user to adjust color calibration, we test at factory settings.
MORE: How Laptop Mag Rates Products
Keyboard Quality
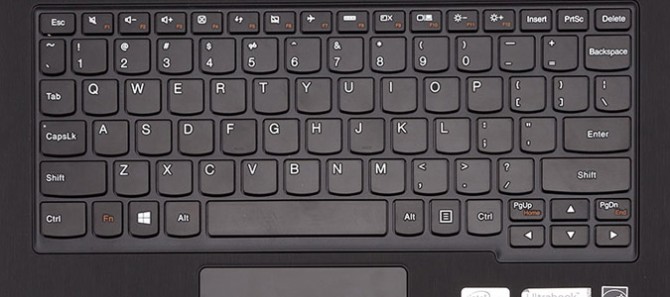
A keyboard is perhaps the one part of a notebook that users come in contact with more than any other, so it stands to reason that we consider keyboard quality paramount. In fact, the keyboard and touchpad make up a significant portion of a brand's overall rating in our annual Best and Worst Brands report. However, we want to provide readers with something more objective than its performance on the Ten Thumbs Typing Tutor test; after all, the results depend on the typing speed and agility of whoever is reviewing that notebook.
We are now measuring two additional metrics--key travel and key actuation--and will be incorporating this data into the reviews. Key travel measures the difference in the height of the key from its resting state to when it is fully depressed. Thinner notebooks will have less travel (perhaps 1 millimeter) while gaming notebooks will have greater travel. Key actuation measures the amount of force, in grams, required for a key to depress.
As time goes on, we'll be looking to refine these and other tests further, as well as introduce others. If you have any ideas for tests we should run on laptops, tablets, smartphones or any other gadget we test, please comment and let us know.
Michael was the Reviews Editor at Laptop Mag. During his tenure at Laptop Mag, Michael reviewed some of the best laptops at the time, including notebooks from brands like Acer, Apple, Dell, Lenovo, and Asus. He wrote in-depth, hands-on guides about laptops that defined the world of tech, but he also stepped outside of the laptop world to talk about phones and wearables. He is now the U.S. Editor-in-Chief at our sister site Tom's Guide, where he oversees all evergreen content and the Homes, Smart Home, and Fitness/Wearables categories for the site..
