How to Make a Treemap in Excel
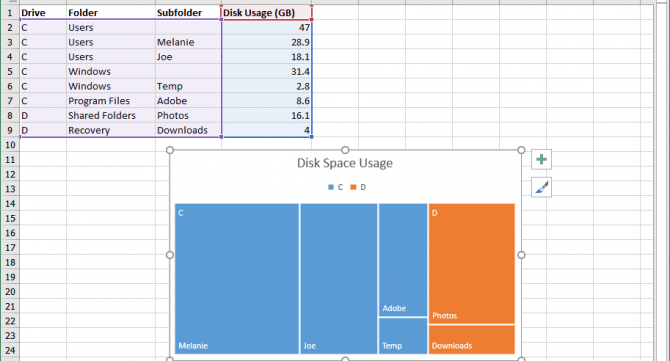
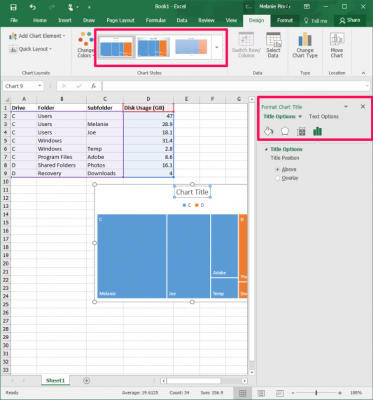
Excel 2016's new Treemap chart offers an interesting way to visualize a hierarchy of data. With it, you can compare data for different categories at a glance, such as revenue for a bookstore by book genre and sub-genres or laptop sales by manufacturer and model. Here's how to create a Treemap in just a couple of clicks
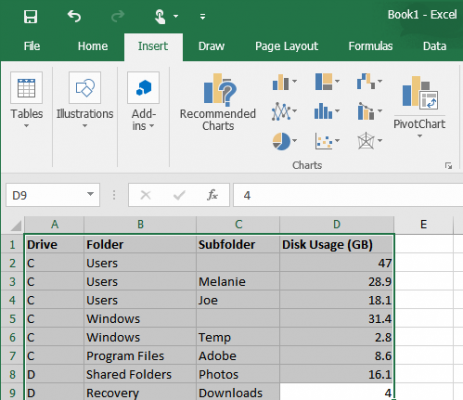
1. Highlight the data you want to use for your Treemap.
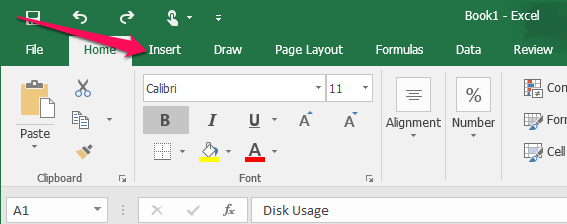
2. Click the Insert tab.
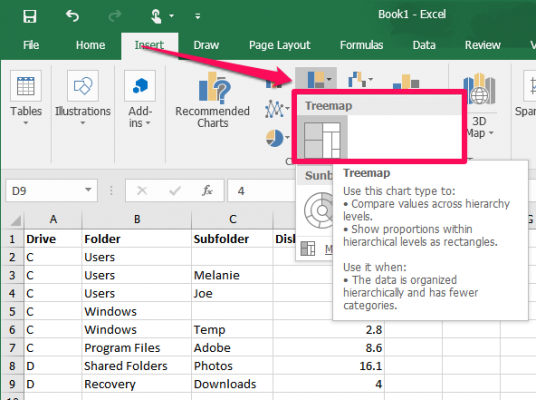
3. Click the Insert Hierarchy button > Treemap. Excel will create and insert a Treemap chart into your spreadsheet.
4. Double-click the chart to format it. You can apply a chart style, for example, edit the chart title, select a different color scheme, and so on.
When your data is logically categorized and ordered, you can use a Treemap to easily find patterns in that information.
Microsoft Excel Tips
- Use VLOOKUP in Excel
- Back Up Files Automatically in Excel
- Remove Duplicate Data in Excel
- Create a Waterfall Chart in Excel
- Lock Cells in Excel
- Freeze Rows and Columns in Excel
- Build a Forecast Chart in Excel
- Create a Funnel Chart in Excel
- Make a Treemap in Excel
- Convert Excel Sheets to Google Sheets
- Open Google Sheets in Excel
- Combine Data from Different Cells
- Merge Cells to Span Multiple Columns
- Use AutoFill for Repetitive Data
- Copy and Paste Repetitive Data the Easy Way
- Use Text to Columns
- Draw Diagonal Line in a Cell
- Create a New Shortcut Menu
- Transpose Columns Using Paste Special
Sign up to receive The Snapshot, a free special dispatch from Laptop Mag, in your inbox.
Melanie was a writer at Laptop Mag. She wrote dozens of helpful how-to guides, covering both the software and the hardware side of things. Her work included topics like SSDs, RAM, Apple, Excel, OneDrive, and detailed guides for Windows users. Outside of all her useful advice, Melanie also penned a few reviews for Laptop Mag, including Android emulators that help you run apps on your PC.
