How to Add a Graph in PowerPoint 2013
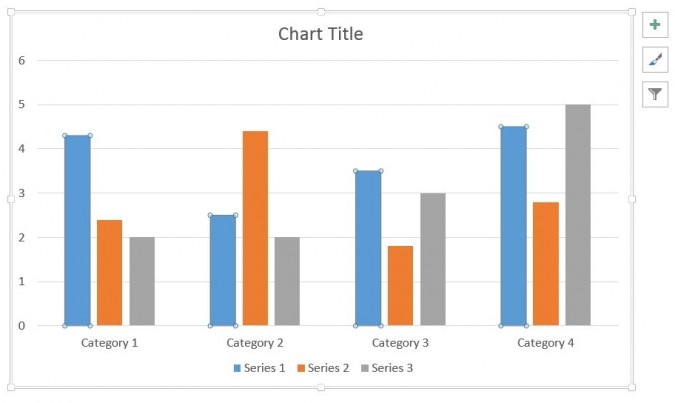
No business presentation would be complete without a plethora of charts, and no business understands this better than Microsoft. With the latest edition of PowerPoint, the software giant has made it easier than ever to add graphs to a presentation and edit them directly from within a slide. Follow this short guide to add charts to your PowerPoint 2013 presentations.
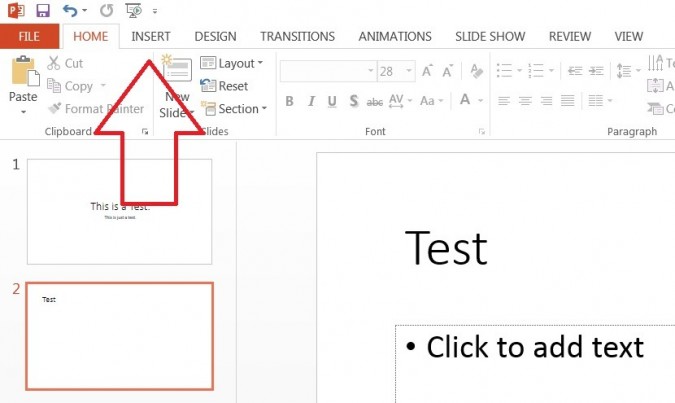
1. Click "Insert" at the top left of the page.
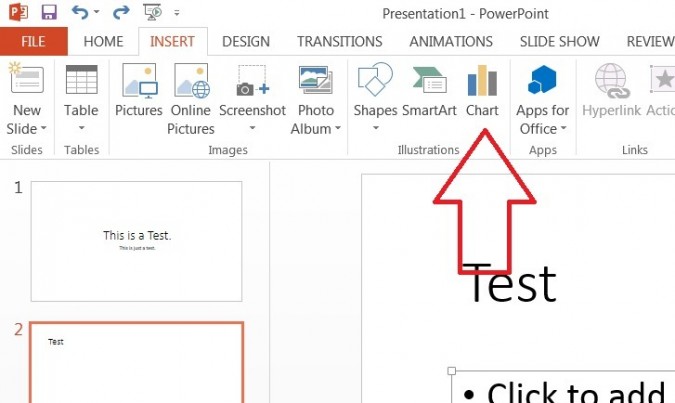
2. Click "Chart" on the left side of the Ribbon.
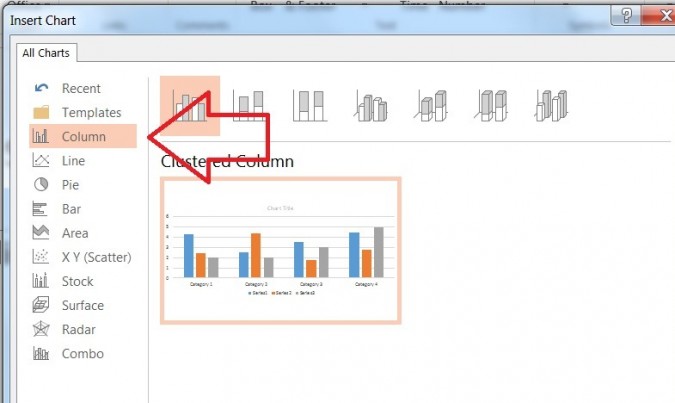
3. Select the chart type you want to insert in your presentation and click "OK" at the bottom of the popup window.
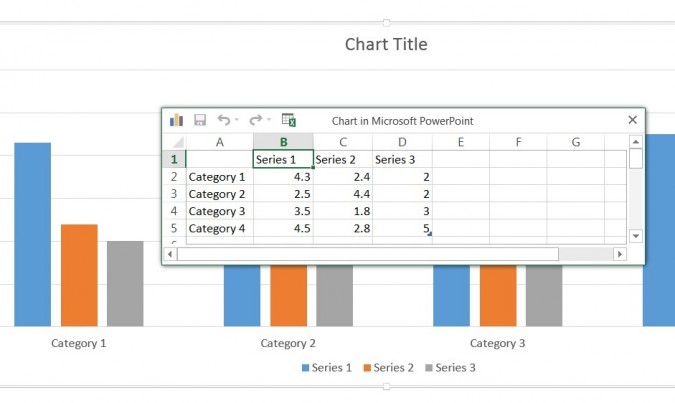
4. Modify the data you want to use in the chart.
Stay in the know with Laptop Mag
Get our in-depth reviews, helpful tips, great deals, and the biggest news stories delivered to your inbox.
David was a writer at Laptop Mag. His coverage spanned how-to guides, reviews, and product rankings. He reviewed Asus, Lenovo, and Gigabyte laptops; guided readers on how to do various things in Excel, and even how to force quit an app in macOS. Outside of Laptop Mag, his work has appeared on sites such as Tom's Guide and TechRadar.
