How to make a graph in Excel
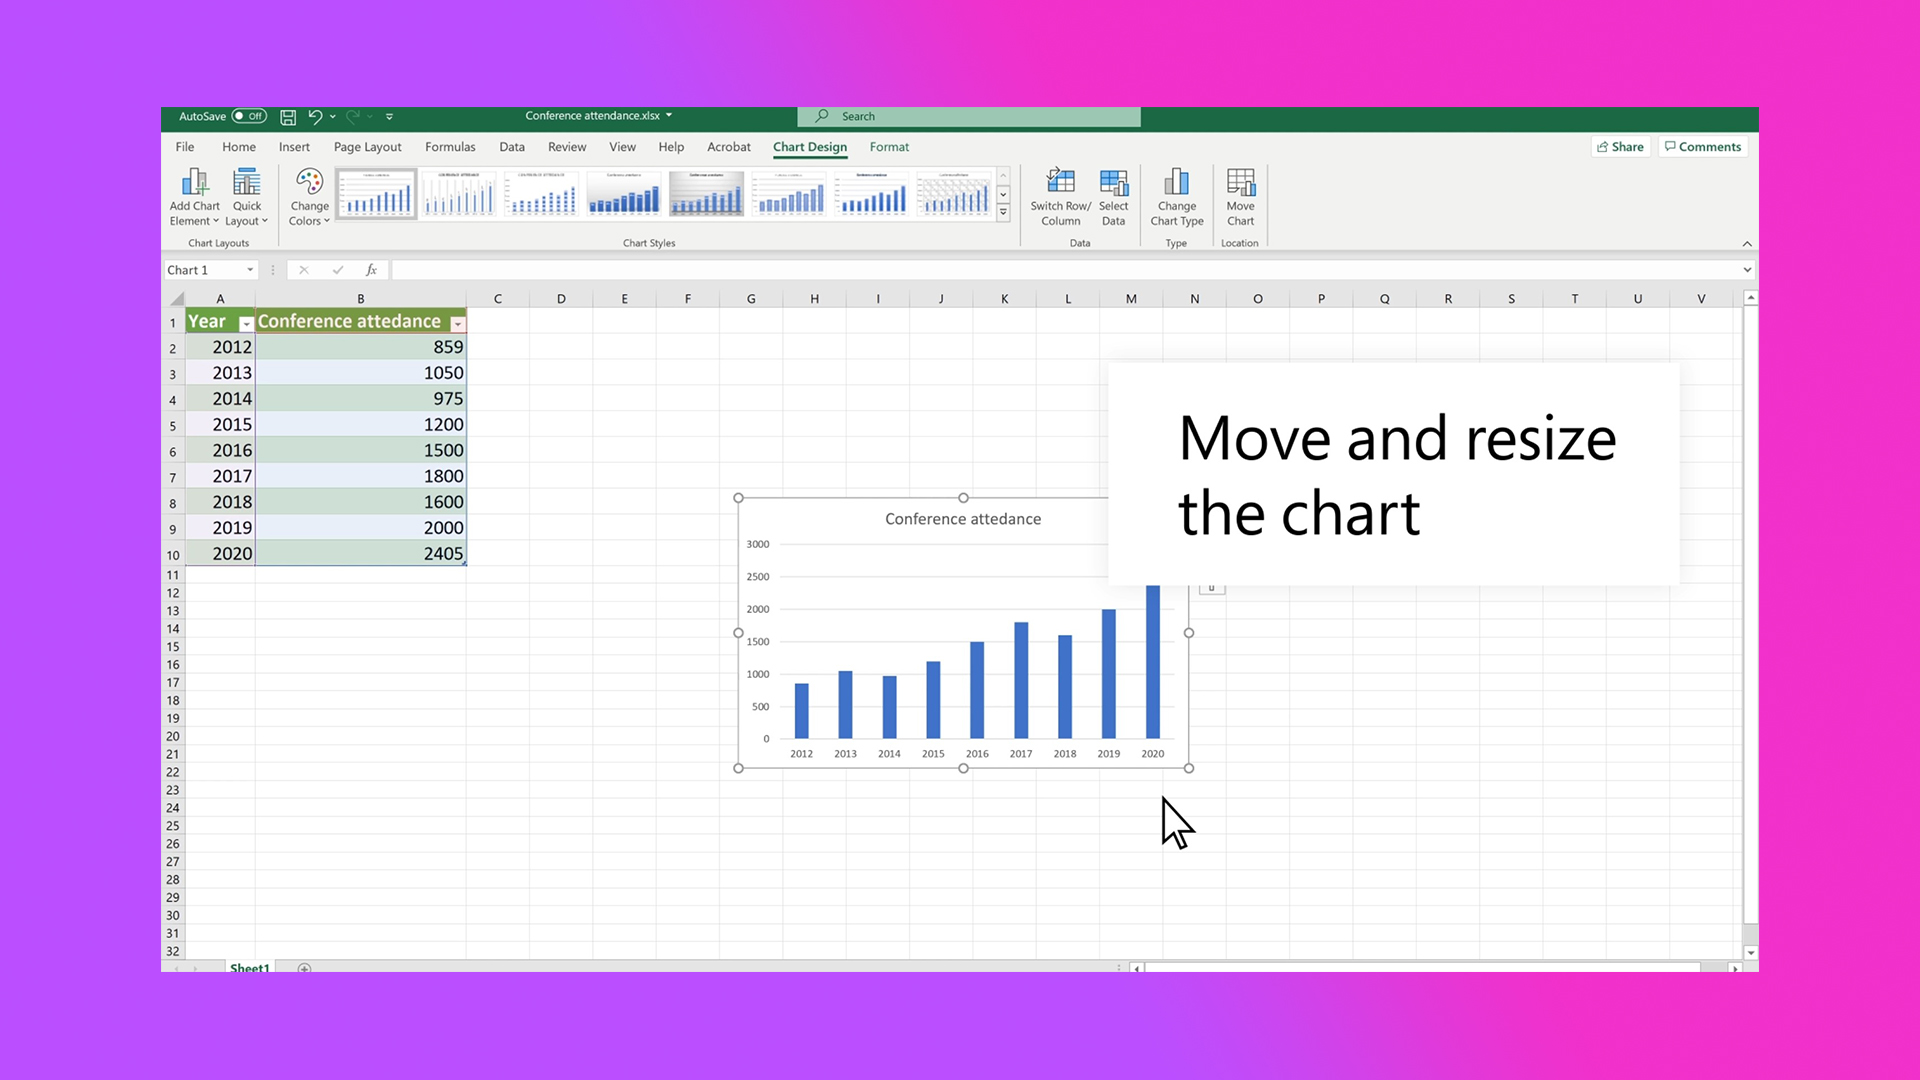
Here's the quickest way to make a graph in Excel

Too many spreadsheets. There are just too many, but sometimes you've got to have them, so if you're struggling, we got your back. Need to make a graph in Excel? No problem!
We've also covered other Excel how-to topics, like how to subtract in Excel and how to filter in Excel.
But today we're going to walk you through how to make a graph in Excel.
How to make a graph in Excel
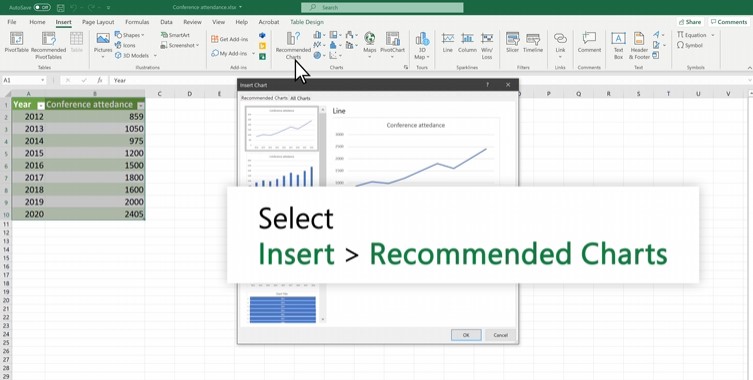
Step 1. Select the data you'd like for your graph.

Step 2. Now go to Insert > Recommended Charts.
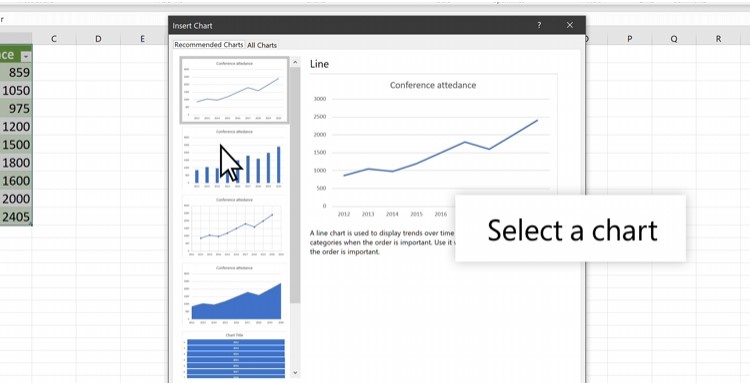
Step 3. You can select a chart on the Recommended Charts tab to now preview the chart.

Step 4. Choose a graph.
Stay in the know with Laptop Mag
Get our in-depth reviews, helpful tips, great deals, and the biggest news stories delivered to your inbox.
Step 5. Click OK.
It's really that simple. You don't have to juggle the Pythagorean theorem to enjoy the wonders of graphs. Don't go pulling your hair out over Excel. There are plenty of Microsoft Excel tips and tricks to make your life easier.

Rami Tabari is the Reviews Editor for Laptop Mag. He reviews every shape and form of a laptop as well as all sorts of cool tech. You can find him sitting at his desk surrounded by a hoarder's dream of laptops, and when he navigates his way out to civilization, you can catch him watching really bad anime or playing some kind of painfully difficult game. He’s the best at every game and he just doesn’t lose. That’s why you’ll occasionally catch his byline attached to the latest Souls-like challenge.


